Whether the Treasury's own cash position is being used to suppress long-end yields, and whether that becomes the dominant financial- conditions story into Jackson Hole. Deutsche Bank called the doubled bond-buyback ceiling "soft-form financial repression" around 08-20; on 08-24 CNBC reported the mechanism — a Treasury General Account holding $935-950bn, some $350-400bn above the level the prior administration targeted, funding the buybacks directly. Commentary has since escalated the framing to "fiscal dominance" — a materially stronger claim that monetary policy is being subordinated to fiscal financing needs, not merely leaned on. Three dated tests land within four days of this thread opening: Lisa Cook's removal deadline (08-26), Jackson Hole (08-27 to 08-29), and Kevin Warsh's first keynote as Fed chair (08-28) — a bond market that has just learned Treasury has been quietly funding its own price support. Track: whether the "fiscal dominance" framing holds or fades, whether Warsh's keynote addresses the TGA mechanism directly, and whether any auction result or yield move ties back to it explicitly.
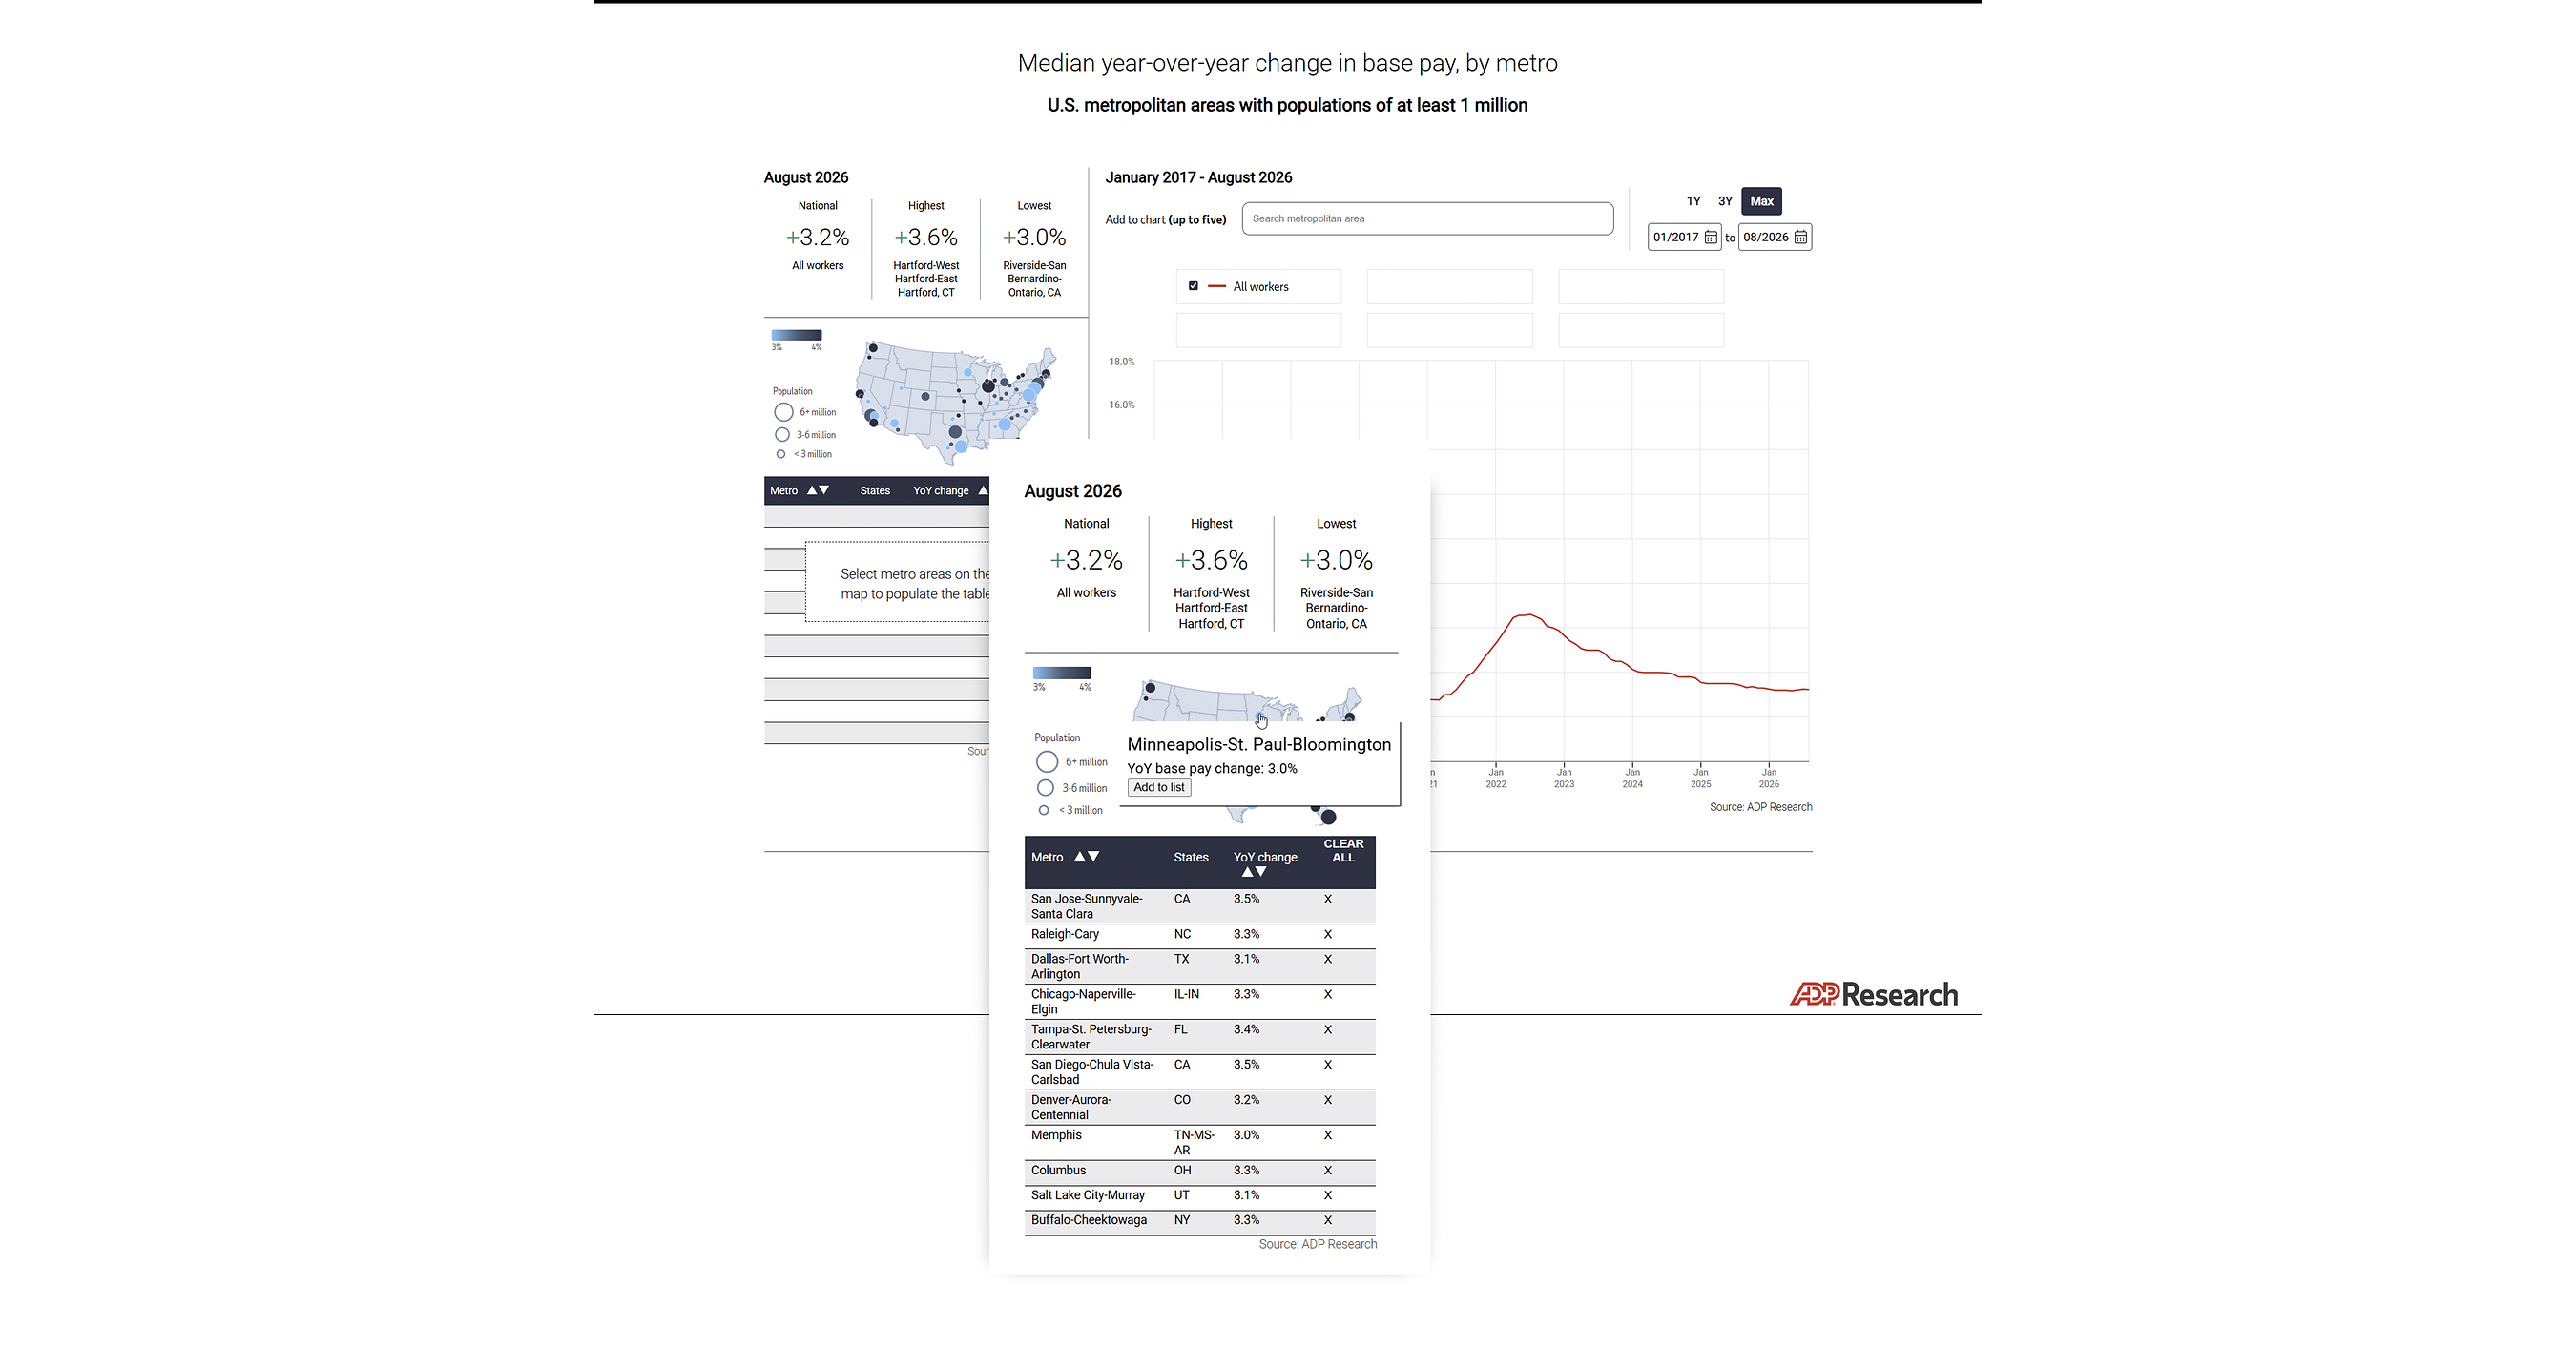
A hot jobs print, not TGA-funded buybacks, moved the long end today: the 2-year Treasury yield jumped 8bp to a post-January-2025 high above 4.416% and the 10-year rose to ~4.77%, reversing Thursday’s Waller-driven rally. This thread’s core question — whether Treasury’s ~$950bn cash cushion can keep suppressing long-end yields against the data — got its first live test since the doubled buyback ceiling was disclosed on 08-19: a genuinely hawkish data surprise moved yields up regardless. No auction or buyback operation is scheduled to have run in this window (the first operation isn’t until 09 September per the standing record), so this is a read on the underlying yield pressure the intervention is meant to counter, not on the intervention’s own mechanics. (BLS, Employment Situation Summary, search-corroborated via Bloomberg, “Treasuries Slide After Strong Jobs Data Lift Fed Hike Wagers” — ⚠️ Bloomberg fetch was paywall-blocked; the 2-year figure is corroborated independently by Yahoo Finance’s 10-year figure)
Norges Bank Investment Management, manager of the world’s largest sovereign wealth fund ($2.3 trillion), recommended cutting its government-bond weighting from 70% to 50% of its benchmark bond index — a change that would cut roughly $80 billion from its current ~$215 billion of US Treasuries (as of end-June), the fund’s single biggest holding, with the freed allocation shifting toward mortgage-backed and other non-government debt. Governor Ida Wolden Bache and CEO Nicolai Tangen wrote that “a government share of 50 per cent will be sufficient to cover the liquidity needs, including in periods of turbulence in financial markets.” This is a foreign-demand-side data point directly on this thread’s own subject — whether Treasury’s cash-cushion campaign can hold up long-end yields against the data — arriving the same day this thread logged the jobs-beat selloff moving the 10-year to ~4.77%. Implementation requires Norway’s finance ministry sign-off and would be gradual “to limit market impact”; nothing has been executed yet. (BNN Bloomberg)
The 10-year printed roughly 4.81% this morning — CNBC’s own headline frames it as the highest level since November 2023, a materially stronger claim than the “since January 2025” framing this thread has carried since 08-31 — inside a selloff CNBC and Capital.com both describe as global rather than US-specific: yields also rose in the UK, Germany, France and Japan on the same session. Tradingeconomics’ intraday feed corroborates a 4.80% high (open 4.764%, low 4.752%), a few basis points below CNBC’s figure — treated as the same move, not two events. A Capital.com analyst quoted: “Renewed hostilities in the Middle East sent crude prices surging, driving Wall Street lower and global bond yields to multi-year — and in some instances, multidecade — highs.” This is the sharpest single-day escalation in the “highest since X” framing this thread has recorded. (CNBC, “10-year U.S. Treasury yield hits highest level since November 2023 as global bond sell-off continues,” dated 2026-09-02, tradingeconomics.com)
A weak ADP print landed the same morning and cuts the other way on this thread’s own hike-odds question: private payrolls rose just 38,000 in August against a Reuters consensus of 48,000 (Dow Jones: 47,000), the softest month since January, while July was revised up to 46,000 from 44,000. Sector detail: education/health +45,000 and leisure/hospitality +16,000 offset manufacturing -17,000 and professional services -16,000. No outlet found in this sweep tied a specific new September-hike-odds number to the ADP release — this thread’s own 65-68% read (per yesterday’s digest) is the last confirmed figure; a genuinely weak jobs print landing the same day yields hit a three-year-plus high is worth holding as an open tension rather than resolving either way. (ADP Research, primary release, dated 2026-09-02 8:15am ET, Investing.com/Reuters)
BOJ Governor Ueda’s post-G20 remark that the board will “decide on policy with upside price risks in mind” pushed September-hike odds to roughly 94% and sent the yen from 160.1 to briefly touch the low-158 level, in the same session the US 10-year set its three-year high. Full entry on AI Debt Gets Rated; cross-referenced here because a Japanese hike into a 3% JGB is the mechanism by which the “global, not US-specific” selloff this thread logged the same day stops being a term-premium story and becomes a flow-of-funds one. (Bloomberg, Nikkei Asia)
The 10-year Treasury yield printed a fresh intraday high of roughly 4.77-4.79% on 09-01, edging past Monday’s already-recorded 4.76%, and the 30-year traded around 5.27-5.28%. Coverage ties the move to a second straight day of rising oil prices after the US struck Iranian rocket launchers on Larak Island in the Strait of Hormuz on 08-30, with Iran retaliating against US forces in Jordan and the UAE — the same oil-driven mechanism already on this thread’s 08-31 entry, extended one more day. (tradingeconomics.com, CNBC, dated 2026-09-01)
Fed September-hike odds jumped sharply — roughly 36-40% a week ago to 65-68% now — on Warsh’s Jackson Hole remarks plus the fresh oil shock, per market-implied pricing cited in the same coverage. This bears directly on the watch line’s “whether any auction result or yield move ties back to it explicitly.”
Bloomberg’s own September framing puts a number on how unusual this stretch is and directly engages this thread’s buyback thesis: the 30-year has closed above 5% on 55 days since January 1, 2026 — the most of any year since 2006 — and analysts quoted argue the Treasury’s buyback program is losing the race against supply. John Briggs (Natixis) called the buybacks “a drop in the bucket” against structural deficit pressure; Priya Misra (JPMorgan) said the buybacks may be “dwarfed by the onslaught of supply from the AI buildout”; Gregory Faranello (AmeriVet) said “if you want to get the long end down, you tighten rates.” September corporate issuance is forecast at $215bn, following record August issuance. (Bloomberg, Yahoo Finance mirror)
The 10-year Treasury yield’s official 09-01 close was 4.79%, per Treasury’s own daily par-yield curve — not a fresh break but an exact tie of 2025’s own high (the 4.79% print from 2026-01-13), closing this thread’s own open question about how much of Monday-Tuesday’s “fresh high” framing would survive contact with the actual print. The 30-year closed 5.27%, in line with the intraday reads already on this thread’s 09-01 entry; the 2-year closed 4.39%, 5-year 4.55%, 7-year 4.66%. This resolves the ⚠️ the 09-01 digest carried explicitly (“none is Treasury’s own closing par-yield print”). (US Treasury, daily par yield curve)
The 10-year Treasury yield rose to 4.76% as of this afternoon (~15:00 ET), its highest level since January 2025, up roughly 0.04 percentage points on the day and marking a fourth consecutive session of increases — a further extension past the 4.72% level this morning’s run recorded. The 30-year moved in step, at 5.25% (+0.04pp). Coverage frames the move as rising oil prices (Brent >$90 on the resumed Iran/Hormuz fighting) reinforcing rather than competing with the post-Jackson-Hole Fed-hike repricing already under way — both inflation-adjacent pressures pushing the same direction on the long end, the exact dynamic this thread exists to track. (Bloomberg, “Treasury 10-Year Yield Tops 4.75%, Highest Since January 2025,” dated 2026-08-31; tradingeconomics.com intraday quote)
✅ Checked against Treasury’s own par-yield series, which sharpens the claim and corrects its stated reasoning. The headline framing — “tops 4.75% for the first time since January 2025” — is not right: the 10-year already closed at exactly 4.75% on 2026-07-31, five weeks ago, which is 2026’s high close. What is right is the “highest since January 2025” part, and only because the intraday print is 4.76%: Treasury’s series has no close at or above 4.76% since 2025-01-14 (4.78%), with 2025’s peak at 4.79% on 01-13. So the move is real but the margin is one basis point over a level already touched this July, not a clean break into new territory. ⚠️ Treasury’s official close for 08-31 posts after the session and is not yet available — this remains an intraday read, same caveat as the 08-28 snapshot this thread had to revise two days later. (US Treasury, daily par yield curve, 2026 and 2025 series)
Treasury’s own daily par-yield curve closes the 08-28 gap this thread’s intraday snapshot left open, and revise its shape: the 2-year rose 14bp to 4.34% close-to-close — the single largest move on the entire curve — not the 5-year, which the 15:04 ET intraday read had flagged as the biggest mover (+9.2bp). Full close-to-close changes, 08-27→08-28: 1mo +3bp to 3.84%, 3mo +6bp to 3.90%, 1yr +11bp to 4.15%, 2yr +14bp to 4.34%, 3yr +11bp to 4.41%, 5yr +10bp to 4.48%, 7yr +7bp to 4.59%, 10yr +6bp to 4.73%, 20yr +3bp to 5.21%, 30yr +3bp to 5.22%. The repricing hump sits at the 2-3 year part of the curve on a full-day basis — front-end/short-belly, not mid-belly — while the 20- and 30-year barely moved at all, confirming rather than overturning this thread’s 08-28 read that the long end stayed untouched. That’s still a data point against the fiscal-dominance/long-end-intervention thesis, just with the specific tenor corrected. (US Treasury, daily par yield curve)
No Treasury auction was held on 08-28 or 08-29 (confirmed directly against TreasuryDirect’s own auction API) and no new Bessent/Treasury statement on the buyback program, TGA or “fiscal dominance” surfaced — the only 08-28 Treasury press release concerns Iran sanctions, unrelated to this thread. The buyback program’s first operation remains scheduled for 09 September, unchanged.
The keynote this thread was waiting on did not touch the long-end or buyback question, and the silence is checkable rather than inferred. Warsh’s “In Our Time,” delivered 10:00 ET, was read directly from the Fed’s own released text: the words “independence,” “administration,” “buyback,” “long end” and “average inflation” appear nowhere in it, and the single occurrence of “Treasury” refers to Treasury securities as one market signal among several the Fed should read. This thread’s watch line asked specifically whether the keynote would address the TGA mechanism. The answer is no — a resolved negative, not a research gap. What he gave instead: a refusal to offer a reaction function (“some simple function like a Taylor rule” cannot be “rigorously relied upon”), an argument that forward guidance “has overstayed its welcome,” 12-month PCE at 3.7% and six-month at 4.1% against a firm 2% target with no averaging language, and a substantial section on AI. (Federal Reserve, released text)
Every point on the curve rose after the keynote and the belly rose hardest: the 5-year +9.2bp to 4.488%, the 10-year +5.6bp to 4.728%, the 13-week bill +5.2bp to 3.730% — and the 30-year up barely 2.2bp to 5.213%. The shape is the finding. A repricing driven by fiscal or term-premium fear shows up in the long end first; this one concentrated in the part of the curve that prices the next several meetings and left the thirty-year nearly untouched — a point of evidence running against this thread’s intervention thesis on this particular day. The dollar rose 0.56%, gold fell 3.28%, and the VIX was essentially unmoved at 14.58, which is a rate-path repricing rather than a risk event. Levels read directly from live quote feeds at 15:04 ET, intraday and not closing prints. ⚠️ No two-year yield is asserted — two sources disagreed on its sign and neither was checkable before Treasury’s own par-yield curve posts after the close, and it is the most-quoted number in today’s coverage. ⚠️ A sweep reported the 10- and 30-year as having “dipped slightly or little changed”; the direct index reads show both rose.